OBJECTIVE: One of the major damage caused by occlusion in roller pumps is hemolysis. Comparative studies between roller pump with adjustments non occlusive and centrifugal pumps have been made in recent decades in an attempt to develop new products and adjustments that cause fewer traumas to the figurative elements of blood. Usually the roller pumps are adjusted by the static method due to concern variables flow that can occur with non-occlusive settings. Excessive slack in the rollers provoke back flow and can provides errors in the calculation of flow by the rotation of the pump, according to the devices added to the circuit and the systemic resistance of the patient. The objective of this study is to evaluate the back flow caused by two types of roller pumps in blood aspirator and cardiotomy reservoir. METHOD: Back flow visualization was performed in blood aspirator and cardiotomy reservoir. It was tested two different models of roller pumps, adjusted by drop rate and dynamic calibration. The tests were conducted with silicone tubes of 3/8 x 1/16 e 1/2 x 3/32 inches in diameter in water and solution similar to blood. RESULTS: We recorded back flow visually in blood aspirator and in cardiotomy reservoir with their measure of values. The pumps had differences in refluxes measured adjusted by the dynamic calibration method. Pump#2 presents back flow adjusted fully occluded. CONCLUSION: The back flow measured in two models of pump present differences (P <0.008). The results indicate differences in its characteristics caused by the process of manufacturing, design or possible wear. Non-occlusive adjustments may cause variations in flow with the increase of resistance added to the circuit, with difficulty to fix the flow by increasing the rotation.
OBJETIVO: Um dos maiores danos causados pela oclusão em bombas de rolete é a hemólise. Estudos comparativos entre bomba de roletes com ajustes não oclusivos e bombas centrífugas têm sido realizados nas últimas décadas na tentativa de desenvolver novos produtos e ajustes que causem menos trauma aos elementos figurados do sangue. Comumente as bombas de rolete são ajustadas pelo método estático devido à preocupação com fluxos variáveis que podem ocorrer com ajustes não oclusivos. Folga excessiva nos roletes permite refluxo e pode acarretar erros no cálculo dos fluxos pela rotação da bomba, de acordo com os dispositivos adicionados ao circuito e a resistência sistêmica do paciente. O objetivo desse trabalho é avaliar o refluxo causado por dois modelos de bombas de rolete em aspirador de sangue e em reservatório de cardiotomia. MÉTODOS: A visualização do refluxo foi realizada em aspirador de sangue e, em reservatório de cardiotomia, a visualização foi acompanhada de respectiva medida. Foram testados dois modelos de bombas de rolete de diferentes fabricantes, ajustadas pelo método de velocidade de queda e calibração dinâmica. Os testes foram conduzidos com tubos de silicone de 3/8 x 1/16 e 1/2 x 3/32 polegadas de diâmetro em água e solução análoga ao sangue. RESULTADOS: Foram registrados visualmente os refluxos em aspirador de sangue e em reservatório de cardiotomia, com respectiva medida dos valores. As bombas apresentaram diferenças nos refluxos medidos ajustadas pelo método de calibração dinâmica. A bomba #2 apresentou refluxo, ajustada totalmente ocluída. CONCLUSÃO: Os refluxos medidos nos dois modelos de bomba apresentaram diferenças (P<0,008). Os resultados indicam diferenças nas características construtivas ocasionadas pelo processo de fabricação, projeto ou possíveis desgastes. Ajustes pouco oclusivos podem proporcionar variações nos fluxos com a resistência adicionada ao circuito, com dificuldade de correção do fluxo pelo incremento da rotação.
INTRODUCTION
The suction system during cardiotomy has been studied since the 60's and causes the decline of a number of platelets and decreases their functions; it's the major cause of hemolysis in patients during extracorporeal circulation [1,2]. Damage to the red cells occurs when air is aspirated with blood through the aspirator [3-5].
In cases where blood is discharged, a few problems occur in aspiration, nevertheless, in extracorporeal circulation the aspirated blood returns to the patient, therefore, the damage during aspiration becomes an important factor and can also affect the surgical procedures.
Part of the circulating blood during the bypass is collected in a recipient and returns to the patient. Studies indicate that a great percentage of total blood flow is returned by the cardiotomic suction system, ranging from 1.5% to 25.3%, depending of the type of surgery [6].
One of the major damages caused by occlusion, when using roller pumps, is hemolysis [7]. Comparisons between roller pumps in standard calibration, with non-occlusive adjustment, and centrifugal pumps were performed and no differences on the level of free hemoglobin in the plasma were found (HLp) [8].
Usually the roller pumps are adjusted by the drop rate method, with 2.5 cm/min from 1000 mm of the physiologic solution column, due to concern about the back flow with non-occlusive adjustments [9].
Excessively tight rollers increase blood traumatism, and may cause accentuated hemolysis. Excessive slack in the rollers provokes back flow and can provide errors in the calculation of flow by the rotation of the pump, according to the devices added to the circuit and the systemic resistance of the patient.
Flow visualization is an essential tool for understanding the complex phenomenon associated to usual flow and it has been applied successfully in biology and medicine. In bioengineering, the markers mostly used are solid micro-particles and markers obtained from food colorants [10].The objective of this study is to evaluate the back flow caused by two types of roller pumps in blood aspirator and cardiotomy reservoir used in extracorporeal circulation. For that purpose, visualization and back flow measurement were applied.
METHODS
The present work was performed at the Experimental Surgery Center of the Universidade Estadual de Campinas - UNICAMP.
Visualization was performed in blood aspirator and in cardiotomy reservoir available in the Brazilian marketplace.
For the visualization it was used a commercial red colorant as liquid marker, in the proportion of 1:50, pumped by an adapted infusion pump. The images were recorded with a Sony Cyber-Shot with 7 Mpixel digital camera.
The tests were performed with two models of roller pump (pump # 1 and pump # 2) DeBakey type, of 6 inches, consisted of two rollers with the following features:
Pump#1 - New (not used previously in surgical procedures), with rotation adjustment precision of ± 0.5 RPM, simultaneous adjustment of the rollers with locking system. Pump#2 - 8 years of use, and usually used in procedures of ECC in perfect working condition. Rotation adjustment precision of ± 0.5 RPM and simultaneous adjustment of the rollers without locking system.
Back flow visualization in blood aspirator
The tests were performed in a commercial aspirator with 34 outlets, being 33 of them equally distributed and one outlet placed in the inferior part.
There were used standard commercial silicone tubes for ECC use with diameters of 3/8 x 1/16 inches. For each test, the circuit containing PVC and silicone tubes was replaced by a standard new one. The water temperature was kept at 25 ± 0.5°C during all the tests.
The tests with the aspirator were performed in two models of pump (pump #1 and #2) adjusted by the drop rate method, with 3 cm/min at 100 cm of column of physiologic solution of NaCl at 0.9% in standard tube of ¼ inches.
The injection beak was placed with colorant flow parallel and perpendicular to the blood aspirator in a glass recipient. The flow was initially adjusted in the pumps for 1 l/min, measured from the pump indicator. The flow was then gradually reduced, varying the rotation until visualization of the back flow. The camera was placed and recording started in open circuit. The water aspirated with colorant was discharged and a complementary pump was responsible for the reposition of water in the glass recipient, adjusted with the same flow maintaining the level constant.
Figure 1 shows the methodology used.
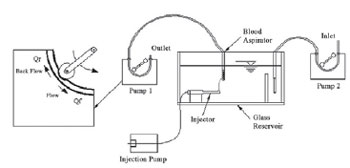
Fig. 1 - Image of the configuration used for visualization in blood aspirator
Visualization in cardiotomy reservoir was performed with a blood analogous solution. This solution was elaborated to simulate blood conditions in surgical procedures with extracorporeal circulation with hematocryte between 25% and 30% at 25°C.
The solution was obtained with mixture of 33% of glycerin (mass), 33% of ethylic alcohol at 95% (mass) and 33% of distilled water (mass). This mixture resulted in a kinematical viscosity í = 2.4 x 10-
6 (m
2/s) and density ρ=1010 (kg/m
3) at 25°C [11].
The essays with a blood analogous fluid were performed at temperature of 25 ± 0.5°C and room temperature of 25 ± 2°C.
The visual recording was performed in the pump models #1 e #2 with silicone commercial tubes of standard diameter of 1/2 x 3/32inches. Each recording was performed with a new tube, being discarded after use.
For measurement and storage of pressure it was used a data acquisition plate (model PCI-9112 - Adlink, Chungho, Taiwan) and a pressure sensor (ASHCROFT WILLY, Instrumentos de Medição Ltda, São Paulo, SP, Brazil), calibrated to the pressure band of -1.10
5 to 2.10
5 Pa, (-750 mmHg to 1500 mmHg).
For flow and back flow measurement it was used a flow meter (Transonic Mod. T206) with a probe for measurement from 0 to 5 l/min response speed of 100 Hz.
A program for data acquisition was developed for reading and filing data.
The adjustment with dynamic calibration was performed filling up the pump circuit with physiologic solution at 0.9% of NaCl, a pressure monitor was installed at the pump's outlet. The rollers were retracted to a non-occlusive position and the pump was started at 10 RPM, constant. The outlet tube was clamped away from the pressure sensor position and the rollers occlusion was adjusted up to the desired pressure [7].
Due to the pulsating characteristic of roller pumps, the values of dynamic calibration pressure were calculated by the mean of the values registered on file (mean DCP). The interval between measurement in the process of dynamic calibration was 20 ms, with total recording duration of 30 s (n=1500). Figura 2 shows the methodology used.
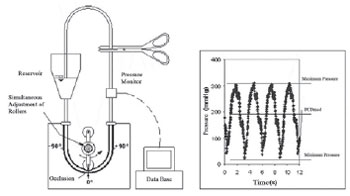
Fig. 2 - Image of the configuration used for dynamic calibration (left). Curve of the pressure records by time (right), for convenience shown only with interval of 12 seconds
For the visual recording it was used a pressure regulating device (valve) to simulate the increase of resistance to flowing from the several devices installed in the circuit, in addition to the patient's own systemic resistance (Figure 3). The values of total resistance added to the circuit were calculated by the mean of values recorded on file (Rtot), with total recording time ranging from 30 to 180 seconds.

Fig. 3 - Image of the configuration used for visualization in cardiotomy reservoir (left). Detail of the pressure adjustment valve (center). Curve of the flow records by time (right), for convenience shown only with interval of 2.5 seconds
Pump#2 was regulated with mean dynamic calibration pressure of mean DCP = 80 mmHg and simulating through a valve the total mean resistance (Rtot) of 150 mmHg at 50 RPM. Pump#1 was regulated with mean DCP = 230 mmHg and Rtot = 320 mmHg at 50 RPM.
In open circuit, the blood analogous fluid aspirated from the cardiotomy reservoir was discharged and the photographic recording was performed until the total deflation of the reservoir that started with com manometric height of 600 mm, measured from the center of the pump.
Back flow measurement
Back flow measurement was performed as shown in Figure 3, closing the circuit and keeping a column of blood analogous solution of 430 mm, measured according to the center of the pumps.
Back flow was measured in two different situations; the first one maintaining the resistances (Rtot) with constant values and varying rotations. The second one maintaining the rotation constant and varying resistances (Rtot).
For the first situation back flow was measured in both models of pumps in rotations: 15, 20, 25, 30, 35, 40, 45, 50, 60, 70, 80 e 90 RPM with mean DCP= 170 mmHg and adjustment totally occluded. For each rotation the back flow was recorded with constant values of Rtot = 140 mmHg, obtained by regulating the valve for each rotation.
The measurement with total occlusion was performed adjusting both rollers in the position 0° (Figure 2 - left), until the drop rate measured was null with a column of 1300 mm of physiological solution at 0.9% of NaCl.
The recording of flow and pressure was performed simultaneously, with an interval between each measurement of 20 ms, for rotation of 15 to 60 RPM, and 10 ms for all other rotations. The duration time for each recording was 30s.
For the second situation, the pumps were maintained with constant rotation of 70 RPM and the back flow was measured with the resistances (Rtot): 50, 100, 185, 220, 250, 290, 330 e 370 mmHg for several adjustments of mean DCP.
For both conditions of back flow measurement there were used new tubes of 1/2 x 3/32 inches of diameter. After each measurement performed with a value of mean DCP (varying rotations or resistances), the tube was disposed and replaced by a new one.
RESULTS
Back flow visualization in blood aspirator
Figure 4 shows the back flow visualization in the aspirator, totally submersed in water, in the flow conditions of 0.3 l/min in different positions.
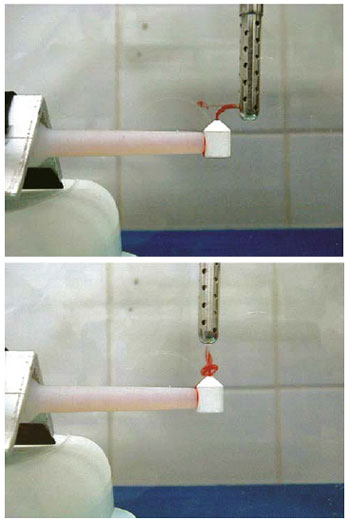
Fig. 4 - Visualization of back flow in commercial blood aspirator in two different positions with water flow at 0.3 l/min
Figures 5 and 6 show photographic recording of back flow with measures simultaneous to the visualization in cardiotomy reservoir with blood analogous fluid. Pump#2, regulated with mean DCP = 80 mmHg and Rtot = 150 mmHg, resulted in mean flow1.48 l/min and mean back flow of 0.61 l/min. Pump#1, with mean DCP = 230 mmHg and Rtot = 320 mmHg, resulted in mean flow of 1.69 l/min and mean back flow of 0.32 l/min.
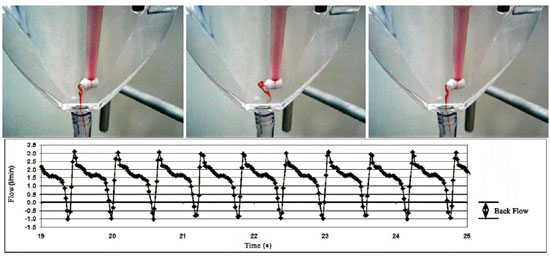
Fig. 5 - Visualization with respective back flow measurement in cardiotomy reservoir. Blood analogous fluid. Pump#2. mean DCP = 80 mmHg and Rtot = 150 mmHg

Fig. 6 Visualization with respective back flow measurement in cardiotomy reservoir. Blood analogous fluid. Pump #1. mean DCP = 230 mmHg and Rtot = 320 mmHg
Figure 7A expresses the behavior of mean back flow according to rotation for both pump models with mean DCP = 169 ± 8 mmHg and Rtot = 140 ± 1 mmHg (mean ± standard deviation). The registers showed normal distribution (
P > 0.05).

Fig. 7 - A: Mean back flow by rotation in cardiotomy reservoir. mean DCP = 169 ± 8 mmHg and Rtot = 140 ± 1 mmHg. B: Mean back flow in resistance function added with constant rotation of 70 RPM. mean DCP = 94 ± 1 (pump#1) and 223 ± 3 mmHg (pump#2)
The variance analysis (ANOVA) showed significant differences in the mean values by the test of Tukey (
P < 0.008).
Figure 7B shows the variations of back flow according to the resistance added with constant rotation of 70 RPM. Pump#1 adjusted with mean DCP = 94 ± 1 mmHg and pump#2 with mean DCP = 223 ± 3 mmHg (mean ± standard error). The registers presented normal distribution (
P > 0.05). The variance analysis (ANOVA) showed similarity in the mean values (
P > 0.96) and the covariance analysis (ANCOVA) showed similarity in the angular coefficients of regressions (
P > 0.59) with different interceptions (
P < 0,004).
The comparison between the values of the dynamic calibration adjustment pressure (n=1500) (mean DCP = 94 and 223 mmHg) showed significant differences (
P < 0.0001).
Figure 8 shows the behavior of the mean back flow according to the rotation for both pump models with total occlusion and Rtot = 250 ± 3 mmHg (mean ± standard deviation).
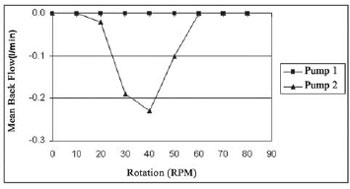
Fig. 8 - Mean back flow by rotation in the pump models #1 and # in cardiotomy reservoir. Blood analogous fluid. Pumps adjusted with total occlusion and Rtot = 250 ± 3 mmHg
Reductions of blood flow in the arterial line in circuits of ECC using roller pumps can be caused by several factors, such as errors in calibration, incorrect occlusion adjustment and resistances added to the circuit [12]. Flow correction can be done by increasing the pump's rotation in order to compensate the back flow [11].
Figure 4 shows the back flow visualized in two different positions with the aspirator model with pump#2. Pump#1 did not present back flow in the same conditions, which indicates constructive differences from the rigid bed profile. This can also be verified with the results expressed in Figure 8, where pump#2 presented back flow even in conditions of total occlusion. This fact may have occurred due to the constructive shape of the rigid bed, which causes the outlet of the roller to abruptly press the tube, thus, causing the fluid to immediately flow back in its interior.
The performance of the flow with added resistance (Rtot) in a roller pump with non-occlusive adjustment by dynamical calibration method has been studied by some researchers. The level of flow resistance increases when devices are added to the circuit during ECC, causing the total resistance to increase its values in a proportion of three to five times higher than the peripheral vascular resistance of the patient.
Comparisons between the adjustments of mean DCP of 350 and 500 mmHg indicate differences in the flow lower than 10% for added pressures lower than 300 mmHg with flow of 3 and 5 l/min. However, significant reduction in flow was developed with pressure around 400 mmHg [9].
Figures 5 and 6 show photographic records in cardiotomy reservoir. The visualization in both established conditions can be compared with the respective recording on file.
Pump#2 presented higher visualization back flow that can be confirmed by the recorded values. It also presented a reduction of 26% compared to the values of total occlusion, showed in the pump indicator. Even with Rtot =150 mmHg the back flow was relevant due to a less occlusive adjustment.
The adjustment performed in pump#1 (Figure 6) is in accordance with the values of pressure for calibration established in literature, between 150 and 500 mmHg [7]. It presented variations of 16% for conditions of Rtot = 320 mmHg and mean DCP = 230 mmHg.
Figure 7A shows the values of back flow recorded for both models of pumps adjusted by the dynamical calibration method. They presented significant differences (
P < 0,008) and indicate that the pumps analyzed have different performance regarding the back flow. That fact is confirmed by the results expressed in Figure 7B, in which the mean values of back flow showed similarity (
P > 0,96) with different dynamical calibration adjustment (
P < 0,0001).
CONCLUSION
The back flow measured in cardiotomy reservoir presented differences (
P < 0.008) between the models of pumps analyzed, suggesting distinctive constructive characteristics between the pumps, differentiated by the process of manufacture, project or possible wear.
In working conditions non-occlusive adjustment can cause back flow and variations in the flow compared by the pump indicator. These variations may present differences according to the model of pump used making it difficult to correct the flow by incrementing rotation.
More detailed studies must be carried out in order to understand the variation of flow with resistance; and compared to different models of pumps.
1. Morris KN, Kinross FM, Stirling GR. Hemolysis of blood in the pericardium: The major source of plasma hemoglobin during total body perfusion. J Thorac Cardiovasc Surg. 1965;49:250-8. [MedLine]
2. Jegger D, Horisberger J, Jachertz M, Seigneul I, Tozzi P, Delay D, et al. A novel device for reducing hemolysis provoked by cardiotomy suction during open heart cardiopulmonary bypass surgery: a randomized prospective study. Artif Organs. 2007;31(1):23-30. [MedLine]
3. Boonstra PW, Vermeulen FE, Leusink JA, de Nooy EH, van Zalk A, Soons JB, et al. Controlled cardiotomy suction during clinical bubble oxygenator perfusions. Thorac Cardiovasc Surg. 1985;33(5):279-82. [MedLine]
4. Clague CT, Blackshear PL Jr. An atraumatic aspirator for use in autologous transfusion and cardiac bypass. ASAIO J. 1995;41(3):M551-6. [MedLine]
5. Clague CT, Blackshear PL Jr. A low-hemolysis blood aspirator conserves blood during surgery. Biomed InstrumTechnol. 1995;29(5):419-24.
6. Edmunds LH Jr, Saxena NC, Hillyer P, Wilson TJ. Relationship between platelet count and cardiotomy suction return. Ann Thorac Surg. 1978;25(4):306-10. [MedLine]
7. Tamari Y, Lee-Sensiba K, Leonard EF, Tortolani AJ. A dynamic method for setting roller pumps nonocclusively reduces hemolysis and predicts retrograde flow. ASAIO J. 1997;43(1):39-52. [MedLine]
8. Hansbro SD, Sharpe DA, Catchpole R, Welsh KR, Munsch CM, McGoldrick JP, et al. Hemolysis during cardiopulmonary bypass: an in vivo comparison on standard roller pumps, nonocclusive roller pumps and centrifugal pumps. Perfusion. 1999;14(1):3-10. [MedLine]
9. Tayama E, Teshima H, Takaseya T, Fukunaga S, Tayama K, Hayashida N, et al. Non-occlisive condition with the Better-Header roller pump: impacts of flow dynamics and hemolysis. Ann Thorac Cardiovasc Surg. 2004;10(6):357-61. [MedLine]
10. Freymuth P. Flow visualization in fluid mechanics. Rev Sci Instrum. 1993;64(1):1-18.
11. Hargrove M, O'Donnell A, Aherne T. Differences in displayed pump flow compared to measured flow under varying conditions during simulated cardiopulmonary bypass. Perfusion. 2008;23(4):227-30. [MedLine]
12. Mongero LB, Beck JR, Orr TW, Kroslowitz RM, Lee-Sensiba K, Oz MC. Clinical evaluation of setting pump occlusion by the dynamic method: effect on flow. Perfusion. 1998;13(5):360-8. [MedLine]
 All scientific articles published at www.bjcvs.org are licensed under a Creative Commons license


 Read in Portuguese
 Portuguese PDF
 Print
Print
 Send this article by email
 How to cite this article
 Submit a comment
 Mendeley
 Pocket